Services
Our team of highly experienced professionals have a proven track record in providing expertise to tender, procurement and project teams, specialising in the following services.

Across Australia, Civil Project Partners works with designers and contractors to develop cost estimates at all stages of the project life cycle. From urban megaprojects to regional and remote infrastructure developments, Civil Project Partners’ agile team is ready to hit the ground running from in every state and territory.
- Preliminary evaluation
- Options analysis
- Business case
- Preliminary design
- Detailed design
- Tendering
- Delivery (variation pricing)
Civil Project Partners is Queensland Department of Transport and Main Roads (TMR) and TfNSW prequalified for Cost Estimating and currently active in delivering P50/90 cost estimate reports to our designer partners, fulfilling the cost estimating obligations of the design brief.
Civil Project Partners also takes pride in the grounded experience of our people, who can leverage construction experience in working with contractors to develop Competitive Tenders underpinned by detailed analysis of first principle options and vendor analysis for our contractor partners.
To enquire further about any of our previous projects for cost estimating services or request a fee proposal for your project, drop us a line by pressing the button below.

Accompanying cost estimates for more accurate cost estimates, the planner brings together the construction methods employed with logic, productions and duration to build-out a timeline of tasks to complete the scope of a project.
Civil Project Partners’ expert team of planners bring together the construction methods employed with logic, productions and duration to build-out a timeline of tasks to complete the scope of a project. This results in far more accurate cost estimates that provide project teams with greater certainty and reduced risk.
Civil Project Partners has extensive experience in delivering Construction Programs to support calculation of construction overheads and overall construction timeframes.
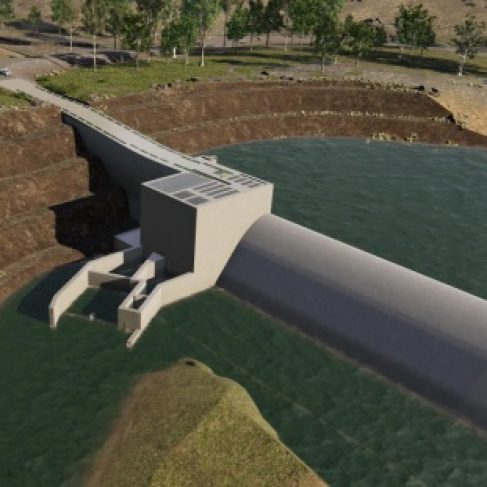
At the forefront of technology and innovation, Civil Project Partners use 4D & 5D Planning – integrating the 3D model, the construction program and cost elements all in one Digital Construction Rehearsal. This approach communicates the intent of the program in a visual medium that very quickly provides clarity to all project stakeholders or as part of a tender submission.
To enquire further about any of our previous projects for program, 4D & 5D planning services or request a fee proposal for your project, drop us a line by pressing the button below.
Utilising world-class random number simulation techniques such as Monte Carlo, Civil Project Partners uncovers the real risks and opportunities linked to a project.
By combining the Risk and Opportunity management of the planned risk (estimate) with the unplanned risk (risk register) Civil Project Partners create P50/90 risk adjusted cost estimates.
When coupled with the risk management processes, Civil Project Partners facilitates workshops that identify, risk rate and reduce project risk.
- Monte Carlo risk simulation
- Risk Context Profiles (RCPs), TMR projects
- Risk assessments, cost estimates
- Risk registers
- Risk and Opportunity Management Plans
- Workshop facilitation
To enquire further about any of our previous projects for Risk and Opportunity services or request a fee proposal for your project, drop us a line by pressing the button below.
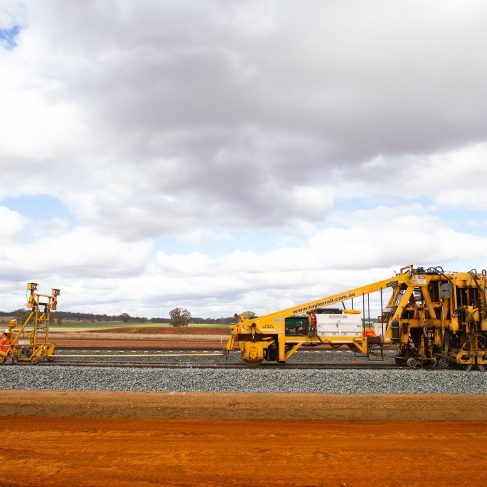
Civil Project Partners team have real world project experience and we leverage our on site experience, to seamlessly integrate into teams and provide resources, expertise and know how, boosting the horsepower for;
- Procurement support during tender
- Project start-up teams for contractors, procurement packages, quality lot management setup
- Delivery support, project engineering roles
- Assist with variation compilation for site teams
To enquire further about any of our previous projects we have provided Engineering Support or request a fee proposal for your project, drop us a line by pressing the button below.
Civil Project Partners Constructability Reports are an essential part of any project as our independence, enables a critical and objective view to satisfy the constructability deliverables for the design team. Civil Project Partners has previously completed numerous Constructabilty Reports across major projects in sectors the length and breadth of Australia.
To enquire further about any of our previous projects we have provided Constructability or request a fee proposal for your project, drop us a line by pressing the button below.
The basis of any robust cost estimate is the quality of the quantification of scope and we are experts at the calculation of resources a project requires.
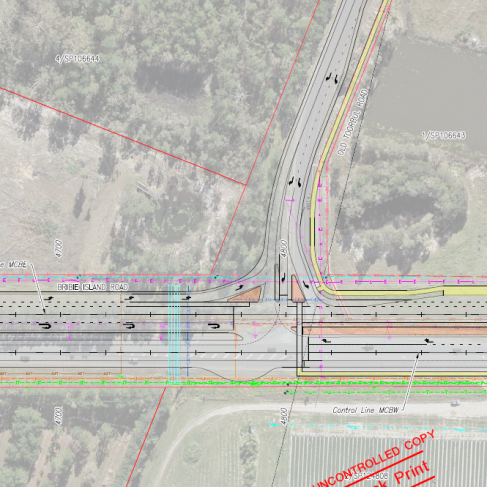
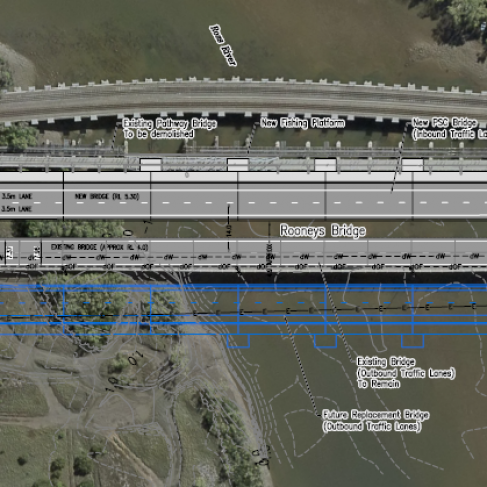
Civil Project Partners utilise specialist software tools such as 12D Model (3D volumes) and Revu Bluebeam (2D plans) to produce highly accurate Quantity Takeoffs. We can also take detailed reports to the next level calculating a bill of quantities (TMR format, for example) for use in the cost estimate basis.
To enquire further about any of our previous projects we have provided Quantity Takeoffs or request a fee proposal for your project, drop us a line by pressing the button below.
At Civil Project Partners, we have started to utilise data to create insights for our team and therefore for our clients. A good example is how we have used readily available data to map infrastructure investment in Queensland.
QTRIP Data
Notes
- Data sourced from https://www.data.qld.gov.au, QTRIP 2021-22 to 2024-25 road networks and https://www.dsdip.qld.gov.au/assessments-and-approvals/coordinated-projects.html, Co-ordinated projects.
- QTRIP data excludes Statewide project budgets.
- Data and legend for each FY22, 23 and FY24-25 can be accessed from the collapsed layer control in the upper-right.
The data show QTRIP information by district and level of investment. A fairly simple analysis, but invaluable for major contractors, supply chain members and more for resource planning, investment planning and more.
We’ve put together a quick reference guide to help understand the services we provide and the terms we use.
Risk
The risk model contains inputs into possible variance of the quantities, rates of items known as planned risk and unplanned risk events from a risk register. The risk simulation is run 10,000 times generally and picks a number within the ranges assigned and calculates an overall outturn cost and plots the result. The software performs this calculation another 9,999 times plotting a point for each simulation, ending up with a histogram of 10,0000 points. The histogram is plotted as a cumulative distribution graph and the 50th and 90th percentile values are read off the cumulative distribution graph. Statistically, P50 and P90 represent the confidence level of a cost not being exceeded. A P50 value has a 50% probability that it will be exceeded, whereas, a P90 only has a 10% probability of being exceeded. As Rumsfeld is often quoted, ‘known unknowns and unknowns unknowns’. Planned risk is almost always represented as risk of items in the bill of quantities which are known scope, and the risk or variance around the quantity, rate or cost drivers. Planned risk will always contribute to the risk output. Unplanned risk on the other hand has a probability of not occurring – for example, risk of an extreme weather event beyond weather averages. Unplanned risk will only contribute to the risk output when the risk occurs in the simulation. If a model is simulated 10,000 times and a risk has a 10% probability of occurring, the risk will contribute to the risk output only 1,000 times. Unplanned risk influences tail risk more so than planned risk. In order to describe the possible variance of a parameter, distribution shapes are used by the risk modeler. Trigen is one of the most commonly used distributions, with three points representing the pessimistic, most likely and optimistic values of a parameter. Pert is similar, however is not linear between points with rounding of the shape resulting in a rounded peak which has slightly more weighting in the most likely part of the distribution. What is P50 and P90?
What is planned and unplanned risk?
What is a trigen or a pert?
Estimating
Development of a cost estimate from the raw resources of plant, labour, materials (and subcontractor) using production rates to determine time taken to complete the task and multiplied by each resource element. Production rates and resources are customized to the construction methodology, site topography and constraints of the project. A contractor’s cost estimate generally comprises of direct job costs (DJCs), indirect job costs (IJCs), offsite overhead, risk and profit margin. DJC is an acronym for direct job costs. The costs represent the cost to perform the work item. In the case of TMR, the MRS specifications itemise the work to be measured. The costs include IJC stands for indirect job costs. Costs include; TC (total cost) = DJC (Direct job costs) + IJC (Indirect job costs) CV is contract value = TC + contractor’s risk + offsite overheads + profit margin What is first principles estimating?
What are IJCs and DJCs?
What are TC and CV?
Escalation
Any project which receives federal funding has escalation calculated from the Project Cost Breakdown worksheet issued by Department of Infrastructure, Transport, Regional Development and Communication. The worksheet has an inbuilt escalation index which adjusts for procurement method, road classification and project stage. We have found certain limitations recently, such as inability to escalate beyond a 10 year timeframe. We are looking forward the new release of the worksheet which should fix that. What is a PCB?
Environment
Environmental and sediment controls. Things like silt fencing, coir logs, check dams and sediment basins. What does ESC stand for?
Cost Estimating
Across Australia, Civil Project Partners works with designers and contractors to develop cost estimates at all stages of the project life cycle. From urban megaprojects to regional and remote infrastructure developments, Civil Project Partners’ agile team is ready to hit the ground running from in every state and territory.
- Preliminary evaluation
- Options analysis
- Business case
- Preliminary design
- Detailed design
- Tendering
- Delivery (variation pricing)
Civil Project Partners is Queensland Department of Transport and Main Roads (TMR) and TfNSW prequalified for Cost Estimating and currently active in delivering P50/90 cost estimate reports to our designer partners, fulfilling the cost estimating obligations of the design brief.
Civil Project Partners also takes pride in the grounded experience of our people, who can leverage construction experience in working with contractors to develop Competitive Tenders underpinned by detailed analysis of first principle options and vendor analysis for our contractor partners.
To enquire further about any of our previous projects for cost estimating services or request a fee proposal for your project, drop us a line by pressing the button below.
Program & Planning
Accompanying cost estimates for more accurate cost estimates, the planner brings together the construction methods employed with logic, productions and duration to build-out a timeline of tasks to complete the scope of a project.
Civil Project Partners’ expert team of planners bring together the construction methods employed with logic, productions and duration to build-out a timeline of tasks to complete the scope of a project. This results in far more accurate cost estimates that provide project teams with greater certainty and reduced risk.
Civil Project Partners has extensive experience in delivering Construction Programs to support calculation of construction overheads and overall construction timeframes.
At the forefront of technology and innovation, Civil Project Partners use 4D & 5D Planning – integrating the 3D model, the construction program and cost elements all in one Digital Construction Rehearsal. This approach communicates the intent of the program in a visual medium that very quickly provides clarity to all project stakeholders or as part of a tender submission.
To enquire further about any of our previous projects for program, 4D & 5D planning services or request a fee proposal for your project, drop us a line by pressing the button below.
Risk & Opportunity
Utilising world-class random number simulation techniques such as Monte Carlo, Civil Project Partners uncovers the real risks and opportunities linked to a project.
By combining the Risk and Opportunity management of the planned risk (estimate) with the unplanned risk (risk register) Civil Project Partners create P50/90 risk adjusted cost estimates.
When coupled with the risk management processes, Civil Project Partners facilitates workshops that identify, risk rate and reduce project risk.
- Monte Carlo risk simulation
- Risk Context Profiles (RCPs), TMR projects
- Risk assessments, cost estimates
- Risk registers
- Risk and Opportunity Management Plans
- Workshop facilitation
To enquire further about any of our previous projects for Risk and Opportunity services or request a fee proposal for your project, drop us a line by pressing the button below.
Engineering Support
Civil Project Partners team have real world project experience and we leverage our on site experience, to seamlessly integrate into teams and provide resources, expertise and know how, boosting the horsepower for;
- Procurement support during tender
- Project start-up teams for contractors, procurement packages, quality lot management setup
- Delivery support, project engineering roles
- Assist with variation compilation for site teams
To enquire further about any of our previous projects we have provided Engineering Support or request a fee proposal for your project, drop us a line by pressing the button below.
Constructability
Civil Project Partners Constructability Reports are an essential part of any project as our independence, enables a critical and objective view to satisfy the constructability deliverables for the design team. Civil Project Partners has previously completed numerous Constructabilty Reports across major projects in sectors the length and breadth of Australia.
To enquire further about any of our previous projects we have provided Constructability or request a fee proposal for your project, drop us a line by pressing the button below.
Quantity Takeoffs
The basis of any robust cost estimate is the quality of the quantification of scope and we are experts at the calculation of resources a project requires.
Civil Project Partners utilise specialist software tools such as 12D Model (3D volumes) and Revu Bluebeam (2D plans) to produce highly accurate Quantity Takeoffs. We can also take detailed reports to the next level calculating a bill of quantities (TMR format, for example) for use in the cost estimate basis.
To enquire further about any of our previous projects we have provided Quantity Takeoffs or request a fee proposal for your project, drop us a line by pressing the button below.
Data and Visual Mapping
At Civil Project Partners, we have started to utilise data to create insights for our team and therefore for our clients. A good example is how we have used readily available data to map infrastructure investment in Queensland.
QTRIP Data
Notes
- Data sourced from https://www.data.qld.gov.au, QTRIP 2021-22 to 2024-25 road networks and https://www.dsdip.qld.gov.au/assessments-and-approvals/coordinated-projects.html, Co-ordinated projects.
- QTRIP data excludes Statewide project budgets.
- Data and legend for each FY22, 23 and FY24-25 can be accessed from the collapsed layer control in the upper-right.
The data show QTRIP information by district and level of investment. A fairly simple analysis, but invaluable for major contractors, supply chain members and more for resource planning, investment planning and more.
FAQs
We’ve put together a quick reference guide to help understand the services we provide and the terms we use.
Risk
The risk model contains inputs into possible variance of the quantities, rates of items known as planned risk and unplanned risk events from a risk register. The risk simulation is run 10,000 times generally and picks a number within the ranges assigned and calculates an overall outturn cost and plots the result. The software performs this calculation another 9,999 times plotting a point for each simulation, ending up with a histogram of 10,0000 points. The histogram is plotted as a cumulative distribution graph and the 50th and 90th percentile values are read off the cumulative distribution graph. Statistically, P50 and P90 represent the confidence level of a cost not being exceeded. A P50 value has a 50% probability that it will be exceeded, whereas, a P90 only has a 10% probability of being exceeded. As Rumsfeld is often quoted, ‘known unknowns and unknowns unknowns’. Planned risk is almost always represented as risk of items in the bill of quantities which are known scope, and the risk or variance around the quantity, rate or cost drivers. Planned risk will always contribute to the risk output. Unplanned risk on the other hand has a probability of not occurring – for example, risk of an extreme weather event beyond weather averages. Unplanned risk will only contribute to the risk output when the risk occurs in the simulation. If a model is simulated 10,000 times and a risk has a 10% probability of occurring, the risk will contribute to the risk output only 1,000 times. Unplanned risk influences tail risk more so than planned risk. In order to describe the possible variance of a parameter, distribution shapes are used by the risk modeler. Trigen is one of the most commonly used distributions, with three points representing the pessimistic, most likely and optimistic values of a parameter. Pert is similar, however is not linear between points with rounding of the shape resulting in a rounded peak which has slightly more weighting in the most likely part of the distribution. What is P50 and P90?
What is planned and unplanned risk?
What is a trigen or a pert?
Estimating
Development of a cost estimate from the raw resources of plant, labour, materials (and subcontractor) using production rates to determine time taken to complete the task and multiplied by each resource element. Production rates and resources are customized to the construction methodology, site topography and constraints of the project. A contractor’s cost estimate generally comprises of direct job costs (DJCs), indirect job costs (IJCs), offsite overhead, risk and profit margin. DJC is an acronym for direct job costs. The costs represent the cost to perform the work item. In the case of TMR, the MRS specifications itemise the work to be measured. The costs include IJC stands for indirect job costs. Costs include; TC (total cost) = DJC (Direct job costs) + IJC (Indirect job costs) CV is contract value = TC + contractor’s risk + offsite overheads + profit margin What is first principles estimating?
What are IJCs and DJCs?
What are TC and CV?
Escalation
Any project which receives federal funding has escalation calculated from the Project Cost Breakdown worksheet issued by Department of Infrastructure, Transport, Regional Development and Communication. The worksheet has an inbuilt escalation index which adjusts for procurement method, road classification and project stage. We have found certain limitations recently, such as inability to escalate beyond a 10 year timeframe. We are looking forward the new release of the worksheet which should fix that. What is a PCB?
Environment
Environmental and sediment controls. Things like silt fencing, coir logs, check dams and sediment basins. What does ESC stand for?