News
The Sting in the Tail
The Sting in the tail
Developing a P50/P90 value is a lot like assessing the threat posed by a scorpion.
You can see its size. You can see its pincers. You can see how close it is to you. And you can see its tail.
But unless you are an arachnologist, it is highly unlikely that you know what the sting in the tail holds. Is it venom? Is it toxic? It is just for show? How much will it hurt if I get hit by the sting in the tail?
When we assess risk, our role is to become the arachnologist for a project. We take every bit of evidence we can see, engage with project champions for each displine and amass every bit of knowledge that we have about similar projects and we assess each against criteria for the project under assessment to do one thing; provide as much certainty as possible and minimise the threat of a nasty sting in the tail.
In this blog, we look at some of the factors that can affect a P90 value based on our experience of supporting major projects across Australia.
Different approaches
Accompanying any robust cost estimate is normally a robust risk assessment. Client’s often specify a P50 / 90 estimate – defined as the value that a cost estimate is not exceeded 50% and 90% of the time, represented by the statistical percentiles 50th and 90th.
Although there is often a risk standard, ISO 31000 specified when performing the risk management services during a cost estimate in planning phase, the specifics around the actual mechanics of the model are left more or less to industry standard.
The federal government (Department of Infrastructure, Transport, Regional Development and Communications) has issued guidance notes (Guidance Note 3A and supplementary guidance, https://investment.infrastructure.gov.au/about/funding_and_finance/cost_estimation_guidance.aspx) which prefer a risk factor methodology approach for projects applying for federal funding, whereas, the models we have developed for TMR project owners are more first principles risk analysis (FPRA) (as defined in the guidance notes). FPRA is more akin to a normal submission schedule with ranges around the quantity and rate, whereas the risk factor approach strips the cost estimate back to the risk drivers, which could be a more aggregated plant, labour, material and subcontractor split.
In any method, a risk model is produced, and distributions are applied to ranges and modelled together.
Inputs and quantification
There are two industry accepted types of risk inputs – planned or inherent risks and unplanned or contingent risks.
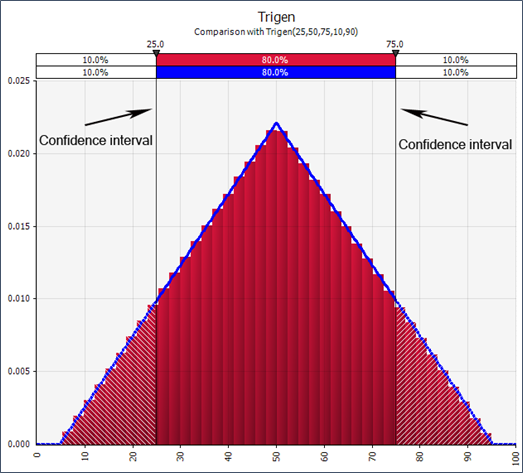
The planned risk originates from the known scope, which is captured in the submission schedule in most cases. For an FPRA, ranges are applied to the quantity and rate variables at a designated confidence level, acknowledging an area of unknown beyond the confidence level, the tail of the distribution.
The risk register forms the basis of the unplanned risk inputs. Risks contained in the risk register have a probability of not occurring. In addition to the quantification of the impact, if the risk eventuates, a binomial distribution is applied to ‘switch’ the impact on and off.
Confidence
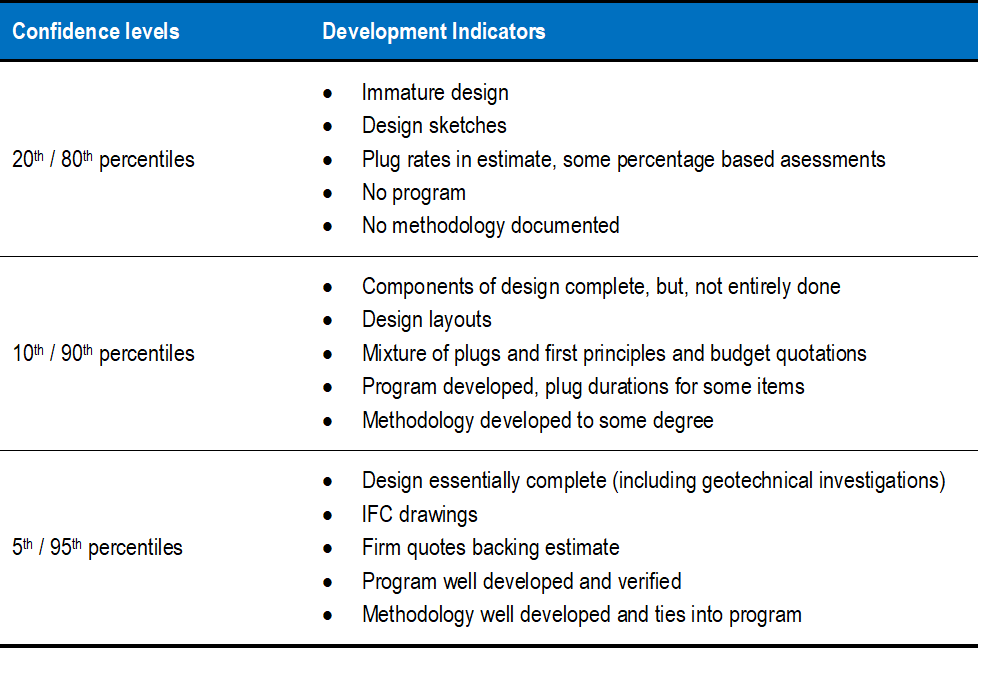
As design maturity develops, the confidence levels may be set closer to the 0% and 100th percentiles. We would normally take the confidence levels to a maximum 5th and 95th percentile, as there is generally always something unknown, even at the detailed design stage (i.e. volume of unsuitable material). To take it to the extreme, to assess at the 0% and 100th percentiles would mean every possible outcome of the risk is known and there is no chance of a value outside the ranges.
While that is very unlikely to happen, our aim is to minimise the uncertainty because the more you know, the more confident that you can be.
We would normally map some indicators around the confidence levels to provide guidance.
Conclusion
We have found that risk inputs containing the following three traits feature in the tail risk of P90 outputs;
- Dominant value risk inputs with low confidence levels (large tails), such as a PUP item scheduled as lump sum, not broken down
- Dominant value risk inputs with wide variance in ranges, such as quantity and rate variance of foundation work items with limited geotechnical investigations conducted
- Low probability unplanned risk inputs with high impacts, weather event such as a 1 in 100 flood or cyclone for example
Projects which can effectively manage the tail risk, have a higher chance of successfully delivering project objectives.